
CLIMATIC TRENDS AND ITS IMPACT ON AGRICULTURE OF KHYBER PAKHTUNKHWA
Samreen Babar* Amjad Amin**
Abstract
United Nation`s climate change report 2013-14 authenticates, if temperature around the world increased by 2 °C, global economic output could downswing by 2 % a year. Pakistan hierarches amid the 20th most climate vulnerable countries over the last 30 years, stated by a British risk assessment consultancy, Maple croft in 2010. Pakistan has endured harsh droughts of 1990`s and sporadic floods of 2010, as the consequences of climate change. Climate fluctuations in Pakistan is observed in terms of declined crop productivity in important crops. Pakistan agricultural statistics (2013-14) shows that agricultural growth rate of important crops has dropped from 7.4 % in 2011-12 to 2.3 % in 2012-13. Likewise, the mega floods of 2010, has drastically dripped agricultural production of Kharif and Rabi crops. Khyber Pakhtunkhwa agricultural statistics showed a drop of Rabi (wheat) output of 1565 Kg/hector in 2008-09 to 1520 Kg/hector in 2009-10 and Kharif (maize) crop output from 1880 kg/hector in 2008-09 to 1783 kg/hector in 2009-10.
This research paper aims, to quantify the changing climate impact in various ecological regions of Khyber Pakhtunkhwa, in terms of agricultural crop output. Khyber Pakhtunkhwa, by ecological landscape can be divided into three regions i.e. the Northern, the central and the southern regions. The study investigates that climate change impact is severe in the southern region of the province. Central zone is facing a moderate impact and the northern region has a positive climate impact.
This paper attempts to assist the concerned authorities in future management and monitoring against the changing climate. Management must deal different ecological regions with different policies and perspectives. These might include efficient water management strategies, early warning systems against floods and the necessary agricultural inputs as biodegradable heat and drought resistant seeds and ecofriendly pesticides and insecticides.
Key words: Agriculture, Climate Change, Crop Production, Ecological Regions
Introduction
Climate change is a phenomenon induced by the greenhouse gaseous (GHG) emissions. The GHG emissions are the consequence of deforestation, fuel combustion, industrialization and urbanization on one hand and solar energy, temperature and precipitation patterns variations on the other. It is a menace to life which largely intrudes snow cover, forests, agriculture, vegetation, water resources, coastal regions, freshwater habitats, and geological processes of melting, land sliding, floods and desertification. These have long-lasting effects on human wellbeing and food sanctuary.
Global food security is correlated with agriculture, and agriculture is vulnerable to climate change. Higher temperatures encourages weeds and pests outburst and eventually reduces crops yield. Variation in precipitation patterns declines long-run productions and escalates the short-run crop malfunction. Even though, crops production in some regions of the world might increase, but overall negative impacts are expected to be realized by climate change.
The global issue of climate change is debated on all plate forms i.e. scientific, economic, social or political. Prevention must be ensured to safe guard the climate from further damage. A need arises on society to comprehend climate, the causes of climate change and its influence on agriculture and economy. In order to draw the supreme authority attention, various climate impact assessment reports are presented by different organizations and agencies. A glimpse of the literature concerning climate change impact is briefed below:
Cline wonderfully enlightens the impact of climate change on global agriculture. His prime argument in this book is that increased yield of crops as suggested by others, are not the result of global warming. He verified his disagreement by comparing different countries current and projected average temperatures and precipitation values. He argued that global warming might be positive for some countries but for developing countries it is displaying negative impacts. He further suggested that the use of carbon fertilizers, heat and drought resistant crops can help in reducing the global warming impact.
Smith, et al (2007), also debated the impact of climate change on agriculture. The transcript explains the significance of agriculture to human life. The author augments that agriculture occupies 40-50% of world`s land surface. It engages about 1.3 billion people globally, and in return feeds the world. Agriculture sector consumes about 87% of underground water and is accountable for 4% of global gross domestic product. The author further discloses the fact that global greenhouse emissions have increased by 17% from 1990 to 2005 that has subsequently reduced the per hector crop yield.
Multiple suggestions are provided for coping with greenhouse gas emissions and increasing the agricultural productivity. These include well prepared agricultural land, fertilizers and livestock management. They further recommends that enhancing the importance of organic feed, elimination of fossil fuel based fertilizers and gradual reduction in inorganic livestock, help in reducing methane gases emissions They also stressed on the importance of agricultural research and development for agricultural knowledge and technology transfer.
Pervez et.al (2010), also carried out a study on climate change impact on Pakistan`s agriculture. The study objective was to observe the impact of climate change on Pakistan`s wheat crop, as it is one of the primary food crops of the country. The analysis was done by adopting the vector auto regression (VAR) model. The study considered annual data from 1960-2009 and predicted the climate trends of wheat production for the period of 2010-2060.The study founded no significant increase or decrease in the wheat crop production. However, depending upon the changing climate, the crop production situation might get worse in near future. The study has also suggested crop adaptation and mitigation techniques for sustaining future climate variability.
Climate change impact on wheat crop production in the province of Punjab is proved in a study conducted by Baig et.al (2011). The purpose of the study is to examine climate variable i.e. the mean maximum temperature, mean minimum temperature and mean rainfall impact on wheat production in Punjab province. The study finds that climate change has quantifiable impacts on wheat output at its various germination stages i.e. at sowing, vegetation and maturity.
Ashfaq et.al (2011), conducted a study on the impact of climate change on wheat crop in the mixed zones of Punjab. The study aimed to observe temperature and rainfall impact on wheat production at sowing, vegetation and maturity stages. The analysis period ranges from 1980-2009. The ordinary least square technique was incorporated for this analysis. The study findings indicated that climate variable shows two sided impacts on crop production. On one hand, rise in maximum temperature at vegetation stage put negative impact on crop production and on the other hand minimum temperature at sowing stage and maximum temperature at maturity stages have positive impact on wheat production. Rainfall also shows positive impact on the wheat crop production i.e. increase in rainfall increase wheat crop production at its various germination stages.
Climate impact on the important agricultural crops i.e. sugarcane, rice, cotton and wheat, in the Punjab region is estimated by Rehana et.al (2012). This study has considered the climate effect at four germination stages of each crop. Time series data for the period 1980-2008 was incorporated for this study. District-wise panel data analysis was done using fixed effect model. The study results revealed that climate variables puts positive impact on wheat crop production the study results are non-positive in case of sugarcane, rice and cotton.
Samreen et, al (2014), conducted a study on the assessment of regional climate impact on the production of two seasons crops in Khyber Pakhtunkhwa. The analysis reviled the variation in production of rabi and kharif crops in relation to the specific region environmental variables. Moreover, region specific regression results of each climatic region proved the influences and impacts of climate change on Khyber Pakhtunkhwa agriculture.
Pakistan`s agricultural sector is prone to sporadic environmental conditions. Issues concerning vulnerability to extreme climate conditions ought to be tackled, to save the country's agricultural sector and sequentially its national economy. This study is unique in detecting the climate trends in various environmental ecological zones of the country i.e. Khyber Pakhtunkhwa. Moreover, this study gives a comprehensive comparison of different climate change patterns among the various ecological regions of the province and reckoning its impact on Pakistan's agriculture sector.
Materials and Methods
Khyber Pakhtunkhwa (KP) is the area selected for this study. It was formerly named North West Frontier Province (NWFP). It is amongst the regions in Pakistan, stricken hardly by the mega floods of 2010. KP has twenty five (25) districts. Khyber Pakhtunkhwa (KP) province has a versatile weather and a unique topography. Its climate ranges from the dry rocky and hot sandy plains in the south to the snowy peaks and lush green forests in the north. KP, according to its climatic variability, can be divided into three ecological zones i.e. the southern, the central and the northern zones. Various districts are selected from these ecological zones to evaluate the regional climatic impact on the two season’s crops i.e. Rabi and Kharif. Below is given the Khyber Pakhtunkhwa map to foster explanation.
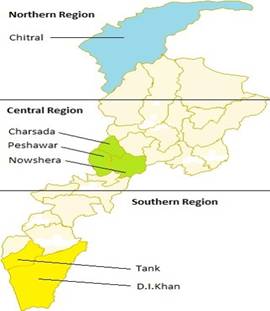
Fig. 1: Khyber Pakhtunkhwa Three Climatic Regions
Sources: Khyber Pakhtunkhwa Maps (2012)
The data collected is secondary in nature. The thirty years (1981-2010), secondary data of the districts mentioned in above graph is collected from the various public organizations i.e. Pakistan Metrology Department, Federal Bureau of Statistics. District Chitral is representing the northern zone, district Charsadda, Nowshera and Peshawar represents the central zone whereas district Tank and Dera Ismail Khan is representing the southern regions of KP.
This research study analyzes the KP crop productivity by two methods. First by the time series trends technique (Malla. 2008). The climate trends analysis of the various KP ecological zones with respect to the overall Khyber Pakhtunkhwa. It helps in clearly depicting the climate change trend over the last thirty years in the two cropping seasons.
The second method of analysis is the panel data regression technique. The purpose of carrying out another analysis is to evaluate the climate variables impact in measurable terms. Each region climate variables along with the crop production statistics are unique. Separate regression analysis is carried out at regional level to capture this impact.
The general form of the model used in this analysis is given below:
Crop`s Productivity = f {Area sown, Climate variables, Climate variables squares}
In equation form;
P = β0 + β1 A + β2Tm + β3 N +β4 N² +µ
Area Sown (A) = Area sown under Rabi and Kharif crops
Crop`s Productivity (P) = Rabi and Kharif season Output. Wheat is
taken as Rabi (winter) crop and Maize as
Kharif (summer) Crop
Climate variables = Mean temperature(Tm) and average Rainfall (N)
Square of Climate = Square of average Rainfall (N²)
Results and Discussion
Climate variables as mean temperature and rainfall effects on crop productivity is analyzed in two different ways. A brief description of each is given below.
The Trend Analysis
The Regression Analysis
Trend Analysis
Trend analysis is a technique, mostly conducted by the environmentalist to check the weather trends of a specific region. The purpose of this analysis is to check if climate variability is observed in Khyber Pakhtunkhwa, over the last 3 decades. Moreover, this analysis helps in the observation of climate variation at different regions of the province
The climate change trends of the two cropping seasons of KP is observed by taking the climate variables of rainfall, maximum temperature, minimum temperature and mean temperature. It is then further compared with the three sub-regions i.e. northern, central and southern regions of KP. The subdivisions of the trend analysis are as under;
- Rainfall Trend
- Maximum Temperature Trend
- Minimum Temperature Trend
- Mean Temperature Trend
i. Rainfall Trend Analysis
The first part of the environmental trend analysis comprises of the rainfall analysis. This analysis is further divided seasonally as the kharif and rabi rainfall trends of the province. Below is given the detailed analysis of each cropping season trend.
- Kharif Rainfall Trend
Kharif Rainfall trend analysis is done by taking the average rainfall values of the kharif season, maize crop, i.e. July, August and September, on Y-axis against the time period on X-axis. Below figure shows four trend lines. The solid line is giving the KP rainfall trend. This shows an increasing trend of rainfall over the thirty year period. The trend analysis shows the increase in overall KP kharif rainfall is up to 11mm. The small dotted line is showing northern zone kharif rainfall trend. There is a slight increase in the rainfall pattern over the thirty year period. This analysis demonstrates an increase in 4mm of rainfall. Similarly, the dashed line in the below figure is depicting the kharif rainfall trend of central region. A steep rise is observed in the central region rainfall over the analysis period. This rise is equivalent to 38mm of rain approximately. Similarly, the southern kharif rainfall trend is seen by a dash and a dot line. This is also depicting the increased rainfall trend up to 19mm.
Years

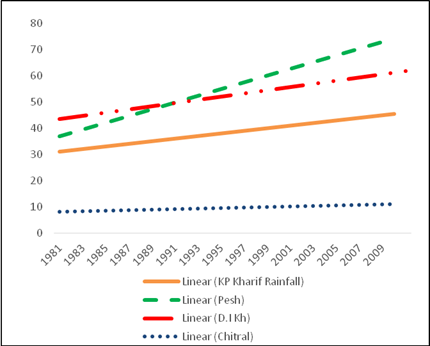
Fig. 2: Kharif Rainfall Trend
All this analysis shows that kharif rainfall has been increased over the thirty year period and much of this increase is observed in the central KP. This clearly explains the untimely rains and flood events in the central part of the province.
- Rabi Rainfall Trend
Rabi rainfall trend analysis is done by taking the average rainfall of the rabi season, wheat crop, i.e. November, December, January, February, march and April. It is then plotted against the time values i.e. years. The figure 3 below is showing the four trend lines. Just like the previous graph, KP trend analysis is shown by the solid line, the northern region by dotted line, central region by dashed trend line and southern region by dash-dotted line. For instance figure 3 depicts an increase in rabi rainfall trend over the period in the whole province. A greater increased trend is seen in the central region of the province i.e. approximately equivalent to 25mm. The northern region and overall KP is showing and increase in rainfall trend of 15mm each, whereas the southern trend line is almost constant at 3mm, with no distinct increase.
Years

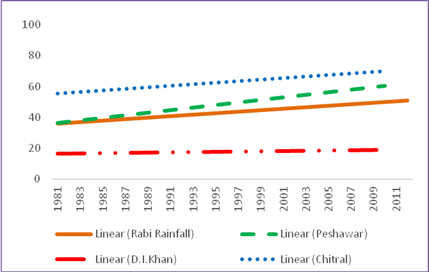
Fig. 3: Rabi Rainfall Trend
ii. Maximum Temperature Trends
The second part of the trend analysis constitutes the maximum temperature analysis. This analysis is further divided into the kharif and rabi cropping seasons. Below is the brief explanation of the trend analysis.
- Kharif Maximum Temperature Trend
Kharif maximum temperature values is obtained by taking the average of the kharif cropping months maximum temperature values. It is plotted year-wisely to plot its trend line for the thirty year period. The figure 4 below explains the situation. There are four trend lines in the figure. Similar to the rainfall analysis the trend line for the overall KP, the northern KP, the Central KP and the southern KP is plotted by a solid, dotted, dashed and dash-dotted lines respectively.
Figure 4 of the kharif maximum temperature analysis shows mixed result. The two KP regions i.e. the central and the southern region is showing a decreasing trend. Whereas, the northern region of the province is depicting an increasing trend of 0.7 °C in the kharif cropping month.
![]()
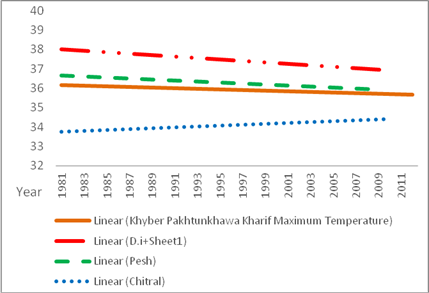
Fig. 4: Kharif Maximum Temperature Trend
The increased maximum temperature is virtually observed in the form of melting glaciers and increased runoffs i.e. its negative impact. As a positive impact maximum temperature has increased the agricultural productivity at the KP northern part.
Similarly the decreased maximum temperature trend of 0.6°C, 1.3°C and 0.6°C at the central, southern and in the overall KP is respectively observed. Along with the other factors effecting crop output, this can also be attributed to the low crop productivity i.e. by immature kharif crops. This also explains the shifting in the kharif crop sowing and harvesting timing.
- Rabi Maximum Temperature Trend
Rabi maximum temperature trend is obtained by taking the average maximum temperature of the rabi season of the respected region. The figure 5 portrays an increased maximum temperature trend in the rabi season in the whole province over the thirty year period. The trend line for the overall KP, the northern KP, the Central KP and the southern KP is plotted by a solid, dotted, dashed and dash-dotted lines.
![]()
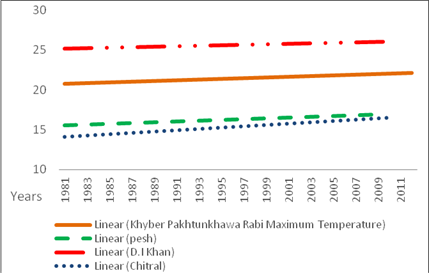
Fig. 5: Rabi Maximum Temperature Trend
The three trend lines of Overall KP, the central region and the southern region shows an almost same degree increase. Moreover in mathematical terms KP increased maximum temperature trend is 1°C, central region as 1.3°C and southern region shows 0.7°C increase. The increased maximum temperature explains the short crop cycle, malnutrition and small sized crop grains in the central and southern part of the province. For instance, the northern region shows an increased maximum temperature of about 2.5°C. In case of northern region, it is putting favorable impacts in terms of crop productivity at the northern regions whereas the alarming fact of 2.5°C increase in rabi maximum temperature is accelerating the glaciers outbursts and melting.
iii. Minimum Temperature Trend
This section constitutes the minimum temperature trends of various Khyber Pakhtunkhwa regions in there kharif and rabi cropping seasons.
- Kharif Minimum Temperature Trend
Kharif minimum temperature trend is obtained by taking the average minimum temperature of the kharif cropping months of different regions separately. Figure 6 below shows the minimum temperature trend of different regions and the overall KP. The trend line for the overall KP, the northern KP, the central KP and the southern KP is plotted by a solid, dotted, dashed and dash-dotted lines respectively.
Years
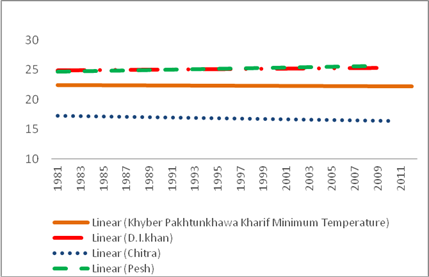
Fig. 6: Kharif Minimum Temperature Trend
The figure 12 above shows two overlapping lines, these are the central and southern region trends. It is showing an increase of 0.7 and 0.8 degree centigrade in minimum temperature of central and southern region respectively. In case of northern region the minimum temperature has shown a decreasing trend of 1.3 °C. The overall KP kharif minimum temperature is showing a slight increase of 0.2 °C.
- Rabi Minimum Temperature Trend
Rabi minimum temperature trend is shown in figure 7. The trend values are obtained by taking the average minimum temperature of the different regions at the rabi cropping months. Below figure shows four trend lines. The dotted line depicts the northern region trend, the dashed line shows the central region, the dash-dotted line explains the southern region trend and the solid line shows the overall KP rabi minimum temperature trend. The figure shows an overall increase in the rabi minimum temperature trend.
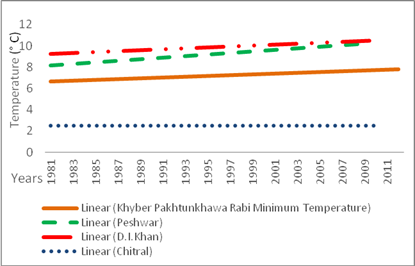
Fig. 7: Rabi Minimum Temperature Trend
The overall KP Rabi minimum temperature is showing a marked increase of 2°C in minimum temperature. The central and southern minimum temperature is also showing a 1.2°C and 1.6°C respective increase. The minimum temperature increase is among the reasons of short crop cycles, pests and weed infestation and unproductive yields. In case of northern region no change is observed in the minimum temperature of rabi cropping season.
iii. Mean Temperature Trend
The fourth and last part of the analysis comprises of the mean temperature trend. The mean temperature values are obtained by taking the average of the maximum and minimum temperature of different KP regions. It is analyzed according to their respective cropping season. Below is the details of the analysis.
- Kharif Mean Temperature Trend
Kharif mean temperature trend values are obtained by taking the average of kharif month’s minimum and maximum temperature. Kharif mean temperature trend is shown in figure 8 below. A decreased trend is observed in the overall kharif mean temperature. The northern, southern and overall KP trend line shows a decreasing trend of 0.3°C. These lines are represented by the dotted, dash-dotted and the solid lines respectively. The dashed line representing central region is depicting no change in the kharif mean temperature.

Fig. 8: Kharif Mean Temperature Trend
- Rabi Mean Temperature Trend
Rabi mean temperature values are obtained by taking the average of the rabi maximum and minimum temperature. Figure 9 of the trend analysis is portraying the variation in the mean temperature of various KP regions. The increased trend values are obvious from the figure below.
The detailed calculation of the trend analysis shows that the northern region trend line, as seen by dotted line, is showing an increased trend of 1°C. The central region trend line i.e. the dashed line, is showing and increased trend of 1.2°C. The southern region trend line i.e. the dash-dotted line, is also showing and increased trend of 1.1°C. Moreover, the overall trend line of KP, as depicted by solid line, is showing an increase of 1.2°C in its mean temperature trend.
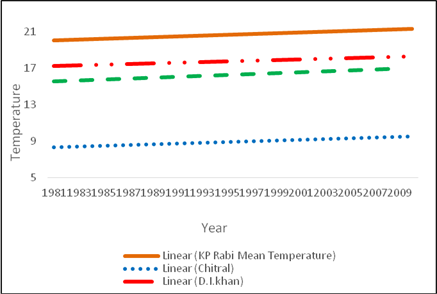
Fig. 9: Rabi Mean Temperature Trend
Summary
Summarizing the whole trend analysis, climate change in KP is perceived in the form of increased rainfalls and increased mean temperature. The trend analysis results are shown in table 1 below.
Table.1: Tabulated Thirty years Cropping Season Trend Analysis
|
Kharif |
Season |
Trend |
|
Rabi |
Season |
Trend |
|
|
Rainfall |
Maximum |
Minimum |
Mean |
Rainfall |
Maximum |
Minimum |
Mean |
Southern |
19mm↑ |
1.3°C↓ |
0.8°C↑ |
0.3 °C↓ |
3mm↑ |
0.7°C↑ |
1.6°C↑ |
1.1°C↑ |
Central Region |
38mm↑ |
0.6°C↓ |
0.7°C↑ |
0.3 °C↑ |
25mm↑ |
1.3°C↑ |
1.2°C↑ |
1.2°C ↑ |
Northern |
4mm↑ |
0.7°C↑ |
1.3°C↓ |
No Change |
15mm↑ |
2.5°C↑ |
No Change |
1°C ↑ |
KP |
11mm↑ |
0.6°C↓ |
0.2°C↑ |
0.3 °C↓ |
15mm↑ |
1°C↑ |
2°C↑ |
1.2°C ↑ |
Khyber Pakhtunkhwa rainfall trend, for both the kharif and rabi cultivation period, has increased over the last thirty years span. This increased rainfall trend ranges from i.e. 3mm-38mm, is physically seen in the form of flash floods, swapped agricultural land and human and animal loss.
Similarly, KP mean temperature in rabi season is showing an increased trend of 1-1.2 degree centigrade whereas the kharif mean temperature is showing a decreasing trend of 0.3 degree centigrade. Moreover, majority of the climate change is observed in the rabi cropping season, which mostly constitutes the KP winter season. It seems that warm winters will be observed in the coming future. Warm winters are the clear indication of intensified greenhouse effect. Climate change has resulted variation in crop sowing and harvesting patterns, early crop maturation, low nutritional food, low crop productivity and intensified weed and pest outbreaks. Furthermore, the increased temperature fact is understood and acknowledged by the scientist and general public in the form of melting glaciers and depleting water reservoirs.
The Regression Analysis
This part of analysis explains the regression analysis, its significance and findings. Panel data analysis technique is incorporated at each ecological region i.e. the southern, the central and the northern zones. Crop production is taken as dependent variable over the other four independent variables i.e. area of the region, mean temperature, rainfall and square of rainfall of the selected cropping months. Panel data, random effect model is the analysis tool employed. The details of region-wise panel data analysis results are given in table 2.
Table 2: KP Region-wise Crop Estimates
Variables |
KP Southern Region Model Estimates |
KP Central Region Model Estimates |
KP Northern Region Model Estimates |
Constant |
76.51*** |
-111.35*** |
-14.48*** |
Area (A) |
0.96*** |
2.926*** |
2.36*** |
Mean Temperature(Tm) |
-2.39*** |
1.933*** |
0.523*** |
Rainfall (N) |
-0.0089 |
0.212*** |
2.51* |
Rainfall Square(N²) |
-0.0000097 |
-0.000567 |
-0.000092 |
R-Square |
0.967 |
0.93 |
0.23 |
Adjusted R-square |
0.96 |
0.92 |
0.17 |
***significant at 1%; **significant at 5%; *significant at 10%
The above table clearly displays the coefficient of the variables incorporated in the three ecological zones analysis. The southern zone model results shows two variables that are significant at 1%. The first significant variable is area, pointing a definite positive impact on the crop productivity of the KP southern zone. A unit increase in the area cultivated leads to increase crop production by 0.96 units. The second significant variable is the climate variable i.e. mean temperature. It is highly significant at 1% significance level and having a negative sign. This depicts the negative impact of temperature on crop productivity. A unit increase in the mean temperature might results in shrinking the crop productivity by 2.39 units. This is scientifically proven fact that higher than required temperature effects crop germination cycles i.e. by quick ripening, undernourished crops, insects and pests infestation etc. The model is 96.7% significant, as is shown by the R-square value 0.967.
The central zone KP model gives R-square value of 0.93, displaying that model is 93% effective. This model is assigning three significant coefficients i.e. Area, Mean Temperature and Rainfall. All are highly significant at 1% confidence level. A unit increase in area might lead to increase crop productivity by 2.926 units. Keeping other conditions constant, the increase in crop production might increase 1.933 units if there is a unit increase in mean temperature. Comparing the mean temperature coefficient value with the southern zone of KP, here it is positive in nature. It clearly depicts that increase in mean temperature has favorable impact on agriculture. The third significant coefficient is of the average rainfall at central KP zone. The positive value shows a positive relation with the crop yield.
The third regression results encompasses KP northern zone. Three of the variables besides its constant intercept are significant in the model. These results illustrates a definite noticeable impact of climate change at the northern zone of KP. The coefficient of area is highly significant at 1% level. It is clearly depicting that a unit rise in area will lead to raise crop productivity by 2.36 units. The coefficient of mean temperature is also highly significant at 1% significance level. It shows that 1unit increase in temperature might increase production by 0.523 units. The third variable, average rainfall is significant at 10% significant level. It is also showing a positive impact on crop`s productivity. All the above regression equations shows that rainfall has quadratic impact on crop production process. It peaks up till a point and then slopes downward. This explains the phenomenon of decreased crop productivity by exaggerated rainfall.
Conclusions and Recommendations
Majority of the grains output and economic prosperity is linked to the rain-fed plains of the province. Out of the total 2.7 million hector cultivable area, 1.8 million hector is cultivated area while 1.08 million hectors is cultivable waste. Moreover, approximately 49% of the cultivable area entails the rain-fed region which is climate dependent. (KP, Statistics 2011)
Summarizing the above analysis in terms of regions specific: it can be concluded that climate variables impact on crop production is highly significant. Harsh climate impacts are seen at the southern zone of KP, in terms of short water supply and scarce rain. Besides, high temperature has affected the crop productivity. Closely observing the other KP zones, climate variables has shown positive impact on northern zones of KP. The northern region climate is cold and dry in nature, increased mean temperature accelerate the crops ripening process. Most of the northern region of the province has embraced forests, thus contributing little to overall crop productivity and agricultural GDP of the province. The central regions of the province are also experiencing a positive impact of climate change. In fact it is limited to a certain limit, crossing the limit leads to a downturn in agricultural productivity.
Pakistan economy is linked to its agriculture, a robust and stable agricultural sector is the need of the day. The effective working of economy is hindered by climate impact issues such as heavy rains, flash floods, plant epidemics, water logging, water salinity, water shortages and droughts. These issues need to be addressed with persuasion and devotion. This research work is a significant asset for the concerned authorities in identifying the problems faced by Pakistan's agricultural sector. The mathematical and theoretical analysis made in this research will help in the identification of the variation in temperature and rainfall patterns at different zones of the province. A few of the recommendations drawn from the above research is as under:
- Research and development by government, in the areas of agriculture, metrological engineering and green energy resource development should be supported and high-lightened.
- Training and skill development should be provided to farmers in mitigation and adaptation against the harsh climate impacts as floods and droughts.
- Technology and agricultural resources should be provided at the farmer`s door step by engaging local or private enterprises i.e. in supplying heat and drought resistance seeds, ecofriendly insecticides and pesticides , green energy techniques
- Climate zones specific crop incentives in the form of Islamic crop insurances, relaxed terms of credits and subsidies be introduced to farmers.
- Metrological information should be shared with the farmers before any calamity strikes again. It can be realized by engaging media and other telecommunication authorities.
References
Ahmad, S., [2010]: Agricultural Census, Pakistan Report. Retrieved from www.statpak.gov.pk, accessed on 12 Dec 2012.
Ahmed, M. [2013]: A Structural Ricardian Valuation of Climate Change Impacts on Agriculture in Pakistan.Series: Schriftenzur international enEntwicklungs- und Umwelt forschung .31. ISBN 978-3-631-65014-1
Agricultural Statistics of Pakistan. [2010-11]: Retrieved from www.pbs.gov.pk.
Agricultural Statistics of Pakistan. [2013-14]: Retrieved from www.pbs.gov.pk.
Amir. P. and Nazareth. F., [2009]: Climate Change Vulnerabilities in Agriculture in Pakistan. International Union for Conservation of Nature. Karachi. A case study.
Aurbarcher, J.,Lippert, C. &Kirmly, T. [2010]: Assessing the Impact of Climate Change in Agriculture in Germany-A Ricardian Analysis. International Agricultural Trade Research Consortium (IATAC).
Ashfaq, et al., [2011]: Impact of climate change on wheat productivity in mixed cropping system of Punjab. Soil Environ. 30(2). Retrieved from www.se.org.pk.
Baig, et al., [2011]: Impact of climate change on wheat productivity in mixed cropping system of Punjab. Soil Science Society of Pakistan. 30(2)
Beverly M. et.al. [2008]: Agriculture at a Crossroads. International Assessment of Agricultural Knowledge Science and Technology for Development. Island Press, Washington D.C Synthesis Report.
Cline, W. [2007]: Global Warming and Agriculture: Impact Estimates by Country. The Peterson Institute for International Economics.
Director Provincial Meteorology. [2012]: Personal Communication
Department of Agricultural Statistics Khyber Pakhtunkhwa. [2011]: Personal Communication.
International Fund for Agricultural Development. [2008]: Climate Change and the Future of Smallholder Agriculture. Discussion Paper. Retrieved from http://www.ifad.org/climate/roundtable
International Union for Conservation of Nature. [2009]: Climate Change Vulnerabilities in Agriculture in Pakistan. A Study.
King, D. [2004]: Climate Change Science: Adapt, Mitigate, or Ignore? Policy Forum Environment. 303. Retrieved from www.sciencemag.org
Khyber Pakhtunkhwa District Map. [2012]: Retrieved from Khyber Pakhtunkhawa maps, www. imgbuddy.com/khyber-pakhtunkhwa-map.asp
Lin.T.et.al. [2011]: Impacts of Climate Change on the People’s Republic of China’s Grain Output—Regional and Crop Perspective. Asian Development Bank Institute Philippines. Working Paper. Publication stock no WPS113172.
Malla, G. [2008]: Climate Change and its Impact on Nepalese Agriculture. The Journal of Agriculture and Environment. Nepal Journal.Vol:9, Review Paper.62.pp.62-65.
Maplecroft. [2010]: Climate Vulnerability News. Retrieved from http://maplecroft.com/themes/cc/
Mustafa, Z. [2011]: Climate Change and Its Impact with Special Focus in Pakistan. Pakistan Engineering Congress, Symposium.33.290.
Nelson, G.et.al. 2009]: Climate Change-Impacts on Agriculture and Cost of Adaptations. International Food Policy Research Institute. Washington. Research Report.pp.4-6.
Pretty, J. [2006]:Agro ecological Approaches to Agricultural Development. Background for World Development International Development Research Centre, Ottawa, Canada. http://siteresources.worldbank.org pp.6-38.
Pervaz et. Al [2010]: Impact of Climate Change on Wheat Production. A Case Study of Pakistan. PIDE Journal. Retrieved from http://www.pide.org.pk/psde/pdf/agm26/day3/Pervez%20Zamurrad%20Janjua.pdf
Rehana, et al. [2012]: The Impact of Climate Change on Major Agricultural Crops: Evidence from Punjab, Pakistan. The Pakistan Development Review 51(4).
Samreen et.al. [2014]: Empirical Assessment of Region Specific Climate Impact on Crops Production In Khyber Pukhtunkhawa, Pakistan. (Author`s paper) Retrieved from www.academia.edu.
Shakoor,et.al. [2011]:Impact of Climate Change on Agriculture: Empirical Evidence from Arid Region.Pak. J. Agri. Sci. 48(4), 327-333; Retrieved from www.pakjas.com.pk.
Smith et.al [2007]: Agriculture. In Climate Change. The fourth Assessment Report of Intergovernmental Panel on Climate change. Cambridge University Press, United Kingdom and New York.
Time Magazine, Roundup UN Report, April 14,2014:8.
Uzma et.al [2011]: Economic Impact of Climate Change on Agricultural Sector of Punjab. Retrieved fromwww.pide.org .
Upreti, D.C. 1998]: Rising atmospheric CO2 and crop productivity. Japan Journal. Crop Sci.67, 3, 394-395.
World Bank . [2010]: The Economics of Adaptation to Climate change. World Bank Publication. Washington. DC. Final Consultation Draft.
World Bank. [2009]: Convenient Solutions to Inconvenient Truth: Ecosystem- based Approaches to Climate Change. World Bank Publication, Washington. DC
* Assistant Professor, Department of Management Science, Bahria University, Islamabad Campus.
** Assistant Professor, Department of Economics, University of Peshawar
Agricultural Statistics of Pakistan. (2010-11). Retrieved from www.pbs.gov.pk.
Upreti, D.C., Rising atmospheric CO2 and Crop Productivity. Japan Journal. Crop Sci.67(3), 1998, pp. 394-395.
Malla, G., Climate Change and its Impact on Nepalese Agriculture. The Journal of Agriculture and Environment. Nepal Journal.Vol:9, Review Paper.62. 2008, pp.62-65.
Nelson, G.et.al., Climate Change-Impacts on Agriculture and Cost of Adaptations. International Food Policy Research Institute. Washington 2009, pp.4-6.
Cline, W., Global Warming and Agriculture: Impact Estimates by Country. The Peterson Institute for International Economics, 2007.
Smith et.al., Agriculture. In Climate Change. The fourth Assessment Report of Intergovernmental Panel on Climate Change. Cambridge University Press, United Kingdom 2007.
Pervaz et. Al., Impact of Climate Change on Wheat Production: A Case Study of Pakistan. PIDE Journal, 2010. Retrieved from http://www.pide.org.pk/psde/pdf/agm26/day3/Pervez%20Zamurrad%20Janjua.pdf
Baig, et al., Impact of Climate Change on Heat Productivity in Mixed Cropping system of Punjab. Soil Science Society of Pakistan. 30(2), 2011, pp. 110-114.
Ashfaq, et al., Impact of Climate Change on Wheat Productivity in Mixed Cropping System of Punjab. Soil Environ. 30(2), 2011, pp. 110-114. Retrieved from www.se.org.pk.